Methodology
This study evaluates the spatial equity of New York City’s Open Streets Program by constructing an accessibility index that measures how effectively Open Streets connect residents to key social determinants of urban well-being. The methodological framework is adapted from Transform Transport’s Access Score (AS) model, which measures cumulative opportunities accessible from each location within a defined spatial threshold.
1. Data Preparation
The datasets listed in Table 1 were obtained through a combination of manual downloads and API-based retrieval. Open Streets location data were downloaded directly from NYC Open Data. School facilities and health facilities data were obtained from their respective New York City and New York State agency portals, each providing address-level facility information.
Jobs accessibility was measured using the Longitudinal Employer-Household Dynamics (LEHD) Workplace Area Characteristics (WAC) dataset. Job counts were extracted specifically for the New York City region at the census block level. Census tract boundaries were downloaded from the U.S. Census TIGER/Line shapefiles and filtered to include only New York City’s five counties.
The H3 hexagonal grid, used as the underlying spatial framework for all analyses, was generated programmatically rather than downloaded as a static dataset, as H3 grids are created algorithmically. A resolution of 8 was selected to balance spatial precision and computational efficiency. Median household income data were obtained at the census tract level using the U.S. Census API, then spatially joined and aggregated to the corresponding H3 cells.
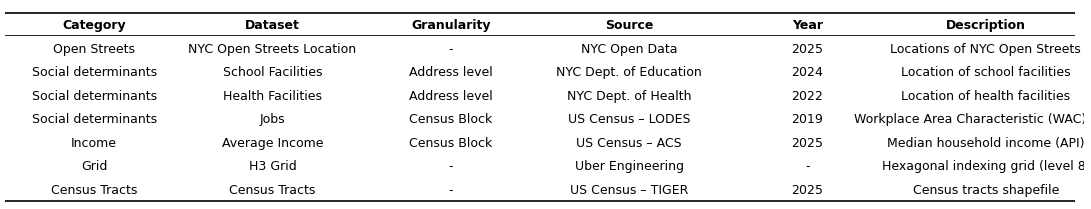
Table 1. List of datasets used in the research
2. Spatial Grid Definition
To standardize spatial units of analysis across the study area, the research employs Uber Engineering’s H3 hexagonal grid system at resolution level 8. This grid produces uniform hexagons across NYC, enabling consistent comparison across neighborhoods. All datasets—Open Streets, socio-demographic variables, schools, health facilities, and job locations—are spatially assigned to their corresponding H3 cells.
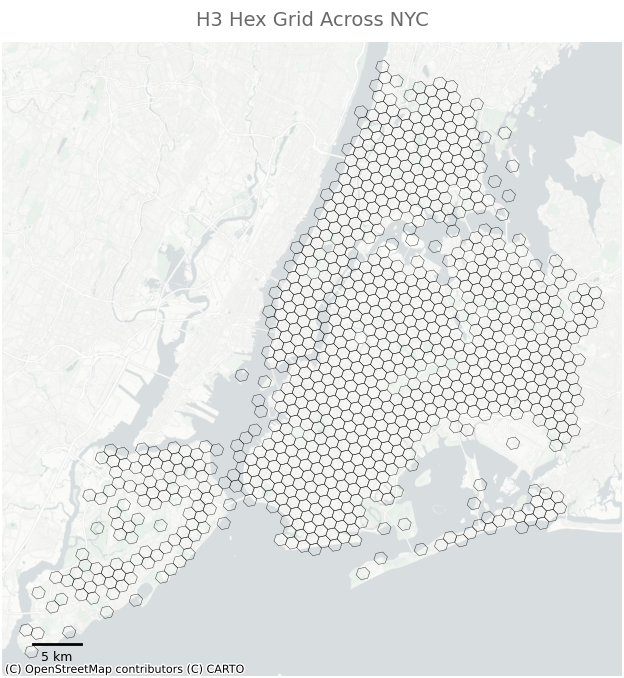
Figure 1. H3 Hex Grid Across NYC
3. Data Integration and Spatial Assignment
Each dataset listed in Table 1 is spatially integrated into the H3 grid to create a unified analytical framework. The procedures for spatial assignment vary by data type as follows.
Open Streets street segments are converted to centroids and assigned to their corresponding H3 cells. This enables the calculation of Open Street density within each hexagon based on the total length of Open Street segments.
School and health facility datasets consist of point-based locations. These points are geocoded and aggregated to H3 cells, producing counts of educational and healthcare service opportunities available within each hexagon.
Employment data are derived from the Longitudinal Employer-Household Dynamics (LEHD) Workplace Area Characteristics dataset. Job counts at the census block level are assigned to H3 cells using block centroids, allowing employment accessibility to be represented at the hex level.
Median household income data are obtained at the census tract level and spatially joined to H3 cells using tract centroids. This process provides a socioeconomic indicator for each hexagon while maintaining consistency across spatial units.
The result of this integration process is a unified hex-level dataset that characterizes each H3 cell by three dimensions: the availability of essential opportunities, the socioeconomic profile of the surrounding population, and the level of Open Street provision.
4. Accessibility Measurement Using K-ring Spatial Catchments
Baseline accessibility to essential services—including schools, health facilities, and jobs—is measured using a k-ring spatial catchment approach. For each H3 cell, a neighborhood defined by k = 2 is generated, representing a walkable catchment area extending two hexagonal cells outward from the origin cell.
Within each k-ring, the cumulative number of opportunities is calculated separately for jobs, schools, and health facilities. These cumulative counts reflect the extent to which each location is structurally well served by essential opportunities, independent of the presence of Open Streets.
Open Streets are intentionally excluded from the cumulative opportunity calculations to ensure that they remain the dependent variable in subsequent analyses. This distinction allows the study to evaluate whether Open Streets are preferentially located in areas with higher baseline accessibility to essential services.
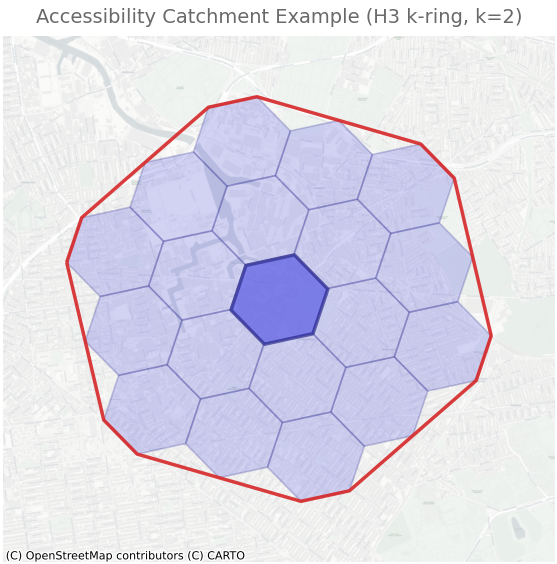
Figure 2. Accessibility Catchment Example
5. Normalization and Construction of the Baseline Accessibility Index
Because opportunity datasets operate in different units and magnitudes, each cumulative opportunity variable is normalized to a 0–1 range using min–max scaling. These normalized values for schools, health facilities, and jobs are then averaged to construct a composite baseline accessibility index (AS_base), representing each hexagon’s intrinsic access to essential social determinants.
\[ AS_{base} = \frac{AS_{school, norm} + AS_{health, norm} + AS_{job, norm}}{3} \]
The baseline accessibility index serves as a structural predictor of areas where residents already experience better access to essential services. This index provides a foundation for testing whether the Open Streets program reinforces or mitigates existing spatial inequalities.
6. Equity Evaluation through Regression Models
To assess whether Open Streets are equitably distributed across New York City, the study examines how Open Street provision varies across hexagons with differing levels of baseline accessibility and income. Two regression models are used for this evaluation.
Regression Model 1: Composite Accessibility Model
\[ OpenStreetLength \sim AS_{base} + Income \]
This model tests whether Open Streets are disproportionately allocated to areas with higher overall access to essential services and higher income levels.
Regression Model 2: Determinant-Specific Model
\[ OpenStreetLength \sim Jobs + Schools + Health + Income \]
This model identifies which specific social determinants are most strongly associated with Open Streets placement across the city.
7. Equity Evaluation through Accessibility Quartile Comparison
Additionally, descriptive analyses of income quartile comparisons and accessibility quartile comparisons, provide intuitive equity diagnostics. These comparisons reveal whether high-income or high-access neighborhoods systematically receive more Open Streets, indicating potential spatial inequities.